Table of Contents
Technical analysis is a trading strategy used to analysis the market behaviors with the use of charts to forecast the future price action based on the past price action. The term price action uses three principal source of information - price, volume and open interest (here open interest only used for future and option).
Three Key Principals based on technical analysis
- Market discounts everything – This is first principle of Dow’s theory and it means that all the information related to company or related industry is already reflected in share price.
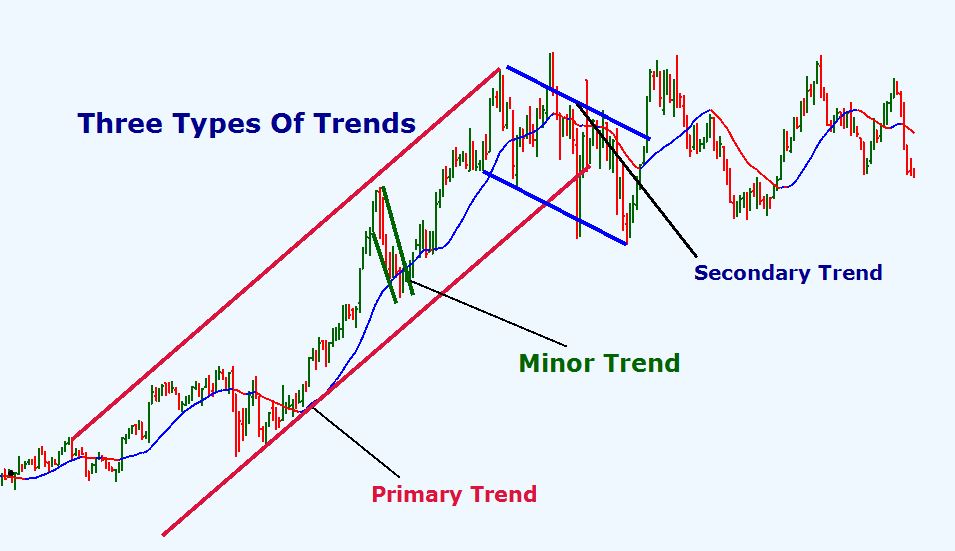
- Price moves in a trend – In stock market prices moves in a trend and there are three kind of trends: the primary or major trend, secondary trend, and the minor trend. The primary trend in share market is the major trend and may last for many years. “A trend in motion is more likely to continue than to reverse”‘
it is just like newtons first law of motion - History repeats itself – it means in same situation same price action happens.

Technical Vs Fundamental Analysis
technical analysis is totally based on price action analysis while on the other end fundamental analysis focuses economic factors, political factors, and other industrial factors. Fundamental analysis is used to find the intrinsic value of an asset while technical analysis is used to identify best supply/demand area based on support and resistances.
Fundamental analysts known as fundamentalist and technical analysts known as technician or chartist. Many fundamental analyst also having some chart reading skills that helps them to take an entry at a best possible price. In a same way many technical analysts also having some basic fundamental analysis skills that helps them to choose best stock at best price.

Sometimes technical analysis may be wrongly interpreted or gives false signal so traders who uses technical analysis for trade selection must be very disciplined to follow rules strictly.
Types of charts Technical Analysts Uses
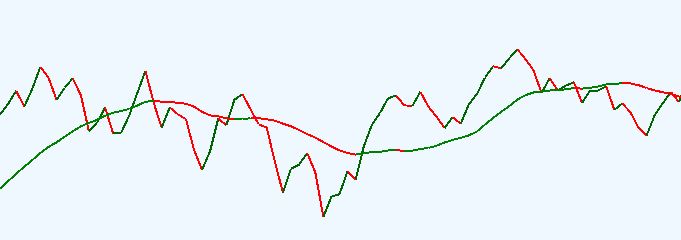
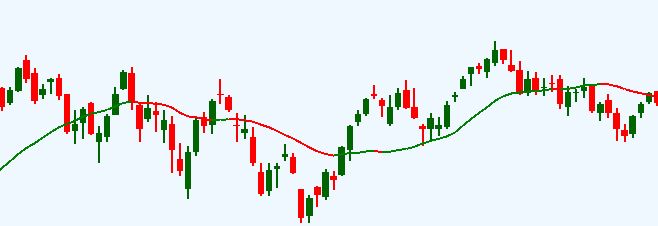
Technical analysts uses price volume charts to see past price behavior of an asset. There are three most common types of technical analysis charts are: Line chart, candle chart, and Bar chart.
Line Charts: Line charts are the most basic type of charts. This charts represents only closing prices of an asset in a particular timeframe.

Bar Charts: Bar charts shows more detailed information about the price movement in a particular timeframe. Bar charts also known as Open-High-Low-Close or OHLC charts.

Candle Charts: Candle charts are the widely used charts by technical analysts. Candle charts also known as Open-High-Low-Close or OHLC charts.

Types of Trends
There are three types trend in technical analysis trading: Up trend, down trend, and sideways trend.
Uptrend: In uptrend the price of an asset moves in upward direction for a longer period of time. Moving average is one of the great indicator that helps beginners to identify trend. Plot 20 period moving average (20 SMA) and If candle or bars are creating above the moving average and moving average direction is upward then trend is uptrend.
Downtrend: In downtrend the price of an asset moves in downward direction for a longer period of time. Moving average is one of the great indicator that helps beginners to identify trend. Plot 20 period moving average (20 SMA) and If candle or bars are creating below the moving average and moving average direction is downward then trend is downtrend.
Sideways: In sideways the price of an asset neither moves in upward direction nor in downward direction, rather price swing up/down in a small range. In sideways bars or candles stick with moving average and moving average also become horizontal.
Disclaimer: The views and recommendations given in this article are for educational purpose. We advise investors to check with certified experts before taking any investment decisions.