Table of Contents
History & Origin Of Candlestick
Welcome back friends, in this article we will try to explore the importance of candlestick chart in technical analysis. Do you know candlestick chart was first introduced by Munehisa Homma a rice trader in 17th century in Japan. He used candlestick chart to predict market movement in rice futures market. His predictions was very much accurate and and he made huge money that time. If we calculate his wealth in today’s term then it was close to $300 billion. That is why he was also known as father of candlesticks.
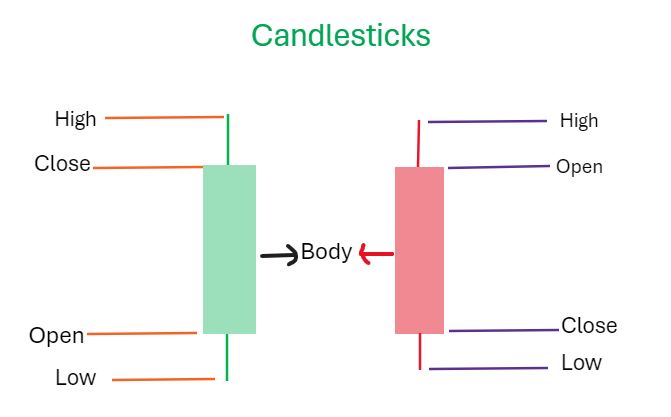
In the 1980s, Steve Nison introduced candlestick charts to the rest of the world. You may read his book Japanese Candlestick Charting Techniques. Unlike line chart which shows only closing prices of a stock in a particular time frame, a candlestick chart displays four price levels such as open, high, low and close that is why candlestick chart also called as OHLC chart. These four price levels helps a technical analyst to know the price range in a particular time frame. So, you will get a detailed picture of how the stock performed within a particulate time interval. Now let’s move ahead and understand the basics of candlesticks. Take a look at the image below.
What Is Candlestick Chart
Candlestick chart is a graphical representation of price movement of any asset like stocks, currency, commodity, forex, etc. in a particular time frame. Candlestick chart is formed using a series of candles where each candle represent specific timeframe(e.g. a day, hour, or minute). Every candle forms using a vertical rectangle and and a wick at bottom and top. In candlestick rectangular box called as the real body shows opening and closing price while wick below the real body denotes low price and the wick above the real body denotes high price in specified time frame. Candlesticks shows four price levels, Open-High-Low-Close and that is why this is also known as OHLC chart. You may
How To Use Candlestick Chart Patterns In Technical Analysis?
Also Read Technical Analysis Charts That A Chartist Uses To Take Best Trading Advantage. Candlestick chart is most popular and widely used chart by technical analyst to analyze the market trend and direction. Using candlestick chart, a technical analyst may easily identify trend reversal patterns that may help to take best possible decision. There are so many candlestick chart patterns that help to take an entry/exit decision at right time and right place. There are mainly three types of candlestick patterns:
- Bullish Reversal Candlestick Pattern
- Bearish Reversal Candlestick Pattern
- Indecisive Candlestick Pattern
In this article we are going to explore Bullish Reversal Candlestick Patterns.
Bullish Reversal Candlestick Pattern
If stock is in downtrend then a bullish reversal candlestick pattern gives reversal signal from downtrend to an uptrend. It gives clue that market sentiments going to change soon. Here is a list of some bullish reversal patterns with brief insight:
- Bullish Engulfing
- Piercing Pattern
- Bullish Harami
- Hammer
- Bullish Abandoned Baby
- Morning Star
Bullish Engulfing
Bullish engulfing pattern is most significant reversal pattern after a leading downtrend. Bullish engulfing is a two candle pattern where current candle fully engulf previous day candle. Bullish engulfing candlestick is a green or white candle that opens lower than previous day’s close and close higher than previous day’s opening. In simple words, Bullish engulfing pattern forms when a small red candle is followed by a green big candle very next day.

| Input Requirement | Description |
| Number Of Candles | Two |
| Leading Price Trend | Leading downward trend needed to form significant bullish engulfing pattern. |
| First Day | Bearish black or red candle |
| Second Day | A white or green candle opens below the previous day’s candle body and closes above that body. shadow engulfing not necessary. |
Piercing Pattern
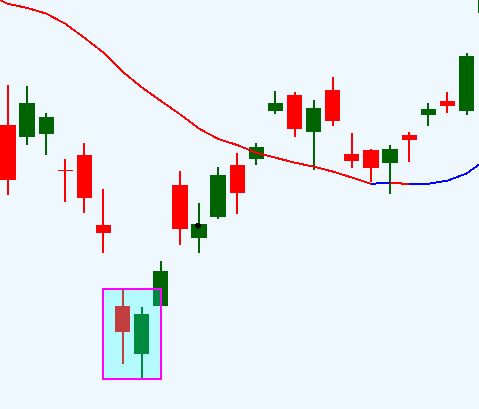
This is a bullish reversal pattern that perform well and reverses the trend 64% of the time in bullish market and 60% of the time in bearish market. This is another two day candle pattern where the current candle goes 50% above the previous day’s candle. This pattern is similar to bullish engulfing pattern but the difference is, in bullish engulfing pattern current candle opens just below the previous day’s candle body and closes above that body while in piercing pattern current candle opens below the previous day candle body and closes at mid point or above mid point of previous day candle body.
| Input Requirement | Description |
| Number Of Candles | Two |
| Leading Price Trend | Leading downward trend needed to form significant bullish Piercing pattern. |
| First Day | Bearish black or red candle |
| Second Day | A white or green candle opens below the previous day’s candle body and closes at or above the mid point of that body. |
Bullish Harami
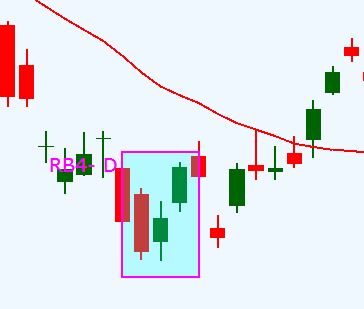
Three inside up is a confirmed bullish harami pattern that formed after leading downtrend. Everyone else will tell you that bullish harami is two candle pattern:
- First day a bearish candle having large body formed
- Second day a bullish candle having small body enclosed within the previous day’s big bearish candle body. The either tops or bottoms of the two bodies can be the same price but not both on them.
Here I am telling you third and confirmation candle that will give strong idea about trend reversal
- Third day bullish green candle that closes above the second day’s bullish inside candle.
Third day confirmation candle is most genuine candle that tells pattern has been formed and bullish reversal begins.
Hammer
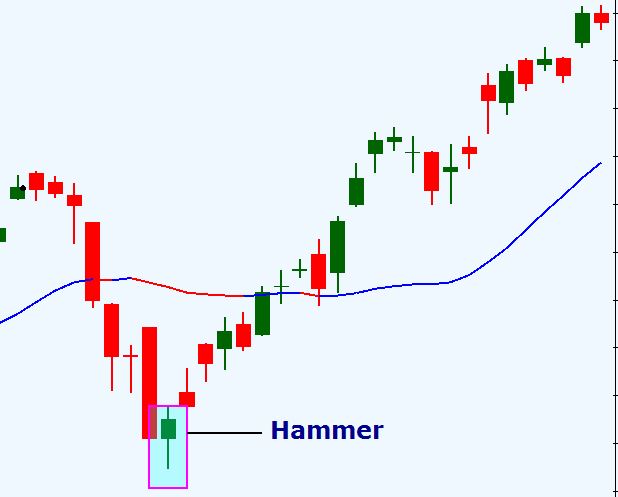
It is a single candle bullish reversal candlestick pattern that hints a possible trend reversal. Hammer pattern looks like a small body at top and long lower wick with small or no upper shadow. In Bullish market it works 60% of the time while in bearish market it works around 59% of the time. This is a most popular candlestick pattern by its name. The single candlestick with small body and long lower wick appears at the bottom after leading downtrend. This candlestick tells that during the day bears force to down the price but before closing bell bulls take control and price recovers up. Body color not important.
Bullish Abandoned Baby
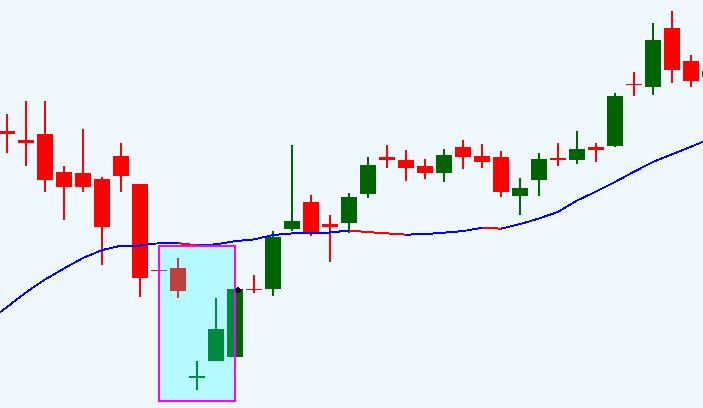
Bullish abandoned baby is one more bullish reversal candlestick pattern that signals end of leading downtrend and a beginning of an uptrend. In this pattern first big bearish candle, a gap down small doji (doji means indecisive), and third one is gap up bullish candle. This bullish reversal pattern works best 70% of the time on bull market and 55% of the in bearish market. This is a rare pattern but works very well.
| Input Requirement | Description |
| Number Of Candles | Three |
| Leading Price Trend | Leading downward trend needed to form significant pattern. |
| First Day | Bearish black or red candle |
| Second Day | gap down doji below the shadow of the candles on both sides. Perfect is very rare |
| Third Day | A green candle whose shadow gaps above the previous day Doji |
Morning Star
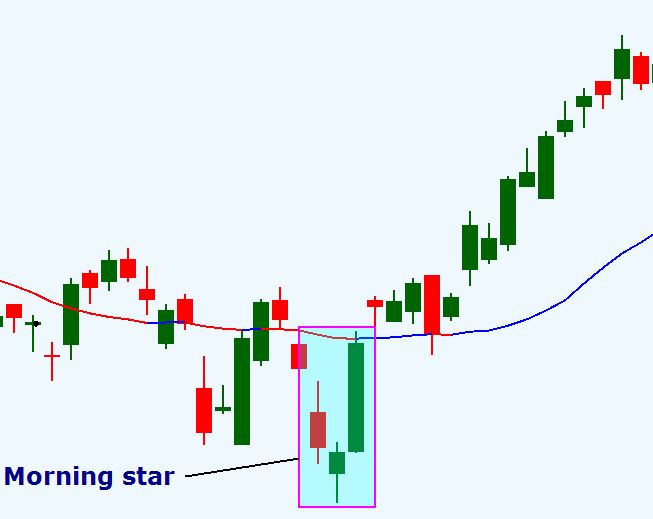
It is one of the best and most trustable bullish reversal pattern that comes after a strong leading downtrend. Its reversal rate in bullish market is 78% that is little better than morning doji star whose reversal rate is 76%. This is an excellent pattern and success rate is too much high. At the bottom, a strong bearish red or black candle forms, very next day a small doji candle (red or green any color) print and third day a strong bullish candle generated that gives signal of strong trend reversal.
| Input Requirement | Description |
| Number Of Candles | Three |
| Leading Price Trend | Leading downward trend needed to form significant pattern. |
| First Day | Bearish red candle |
| Second Day | small doji candle where color not important |
| Third Day | A green candle gaps above the previous day Doji and closes at or above the mid point of first day bearish candle. |
In this article I gave a brief information about some important bullish reversal candlestick pattern but will cover full analysis about each pattern in a separate article Also other two types of candlestick patterns “Bearish Reversal Candlestick Pattern” & Indecisive Candlestick Patterns Will discuss in next article. I hope you liked this article so please share your views and feedback to us.
If you want to know about type of candlestick charts then read Technical Analysis Charts That A Chartist Uses To Take Best Trading Advantage
