Table of Contents
Technical Analysis Charts
Technical Analysis Charts are basically just a graphical representation of historical data that a chartist may use to take best possible trading decision. Using technical analysis charts an expert chartist may understand what the institution and/or big players doing in that particular stock or any other asset. Using technical analysis charts a technical analyst may easily identify best possible support and resistance (Demand and Supply Zone).

There are so many charts are available to do technical analysis but technical analysts or chartist uses three most popular technical analysis chart types: Line chart, Bar Chart, & Candlestick chart. Charts shows two dimensional graph x-axis shows time and Y-axis show price. Charts can be plotted for any time frame like 1-minute , 3-minute, 5-minute, 15-minute, 1-hour, 4-hour, 1-day, 1-week, 1-month,, etc. Best thing about technical analysis is that charts works in same manner for any time frame. many technical analysts use indicators to take trading decision and many other use chart patterns to find best entry/exit levels. If you are beginner then read How to Use Technical Analysis and Fundamental Analysis to Your Advantage
Line Chart:
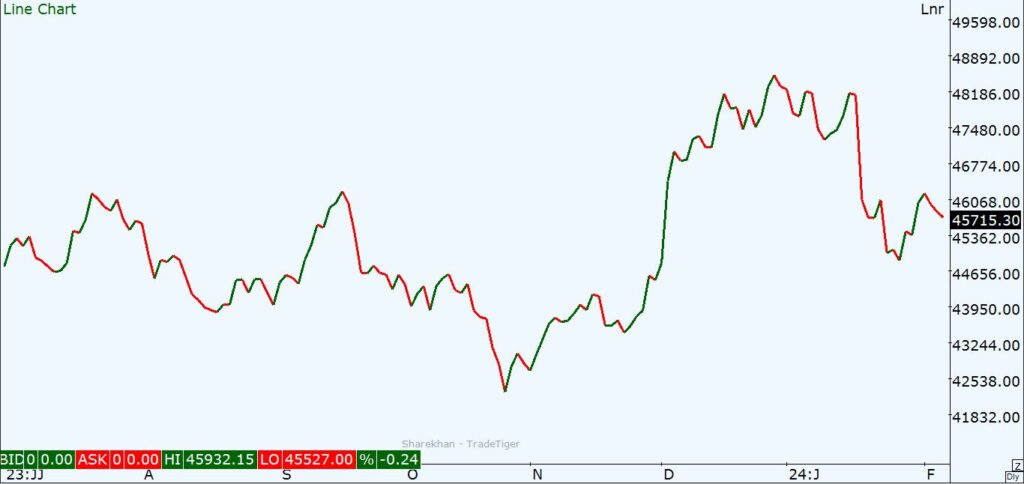
Lets begin with line chart first. Line chart is the most basic type of technical analysis chart that is used to know the trend of the market using closing prices. In line chart, on a particular timeframe every closing price denoted as a dot and when these dots connected then a line chart forms. This chart is most basic but you may use it to compare price trend between multiple stocks when plotted on a same graph. Line chart gives very clear view about the trend of the market.
Bar Chart:
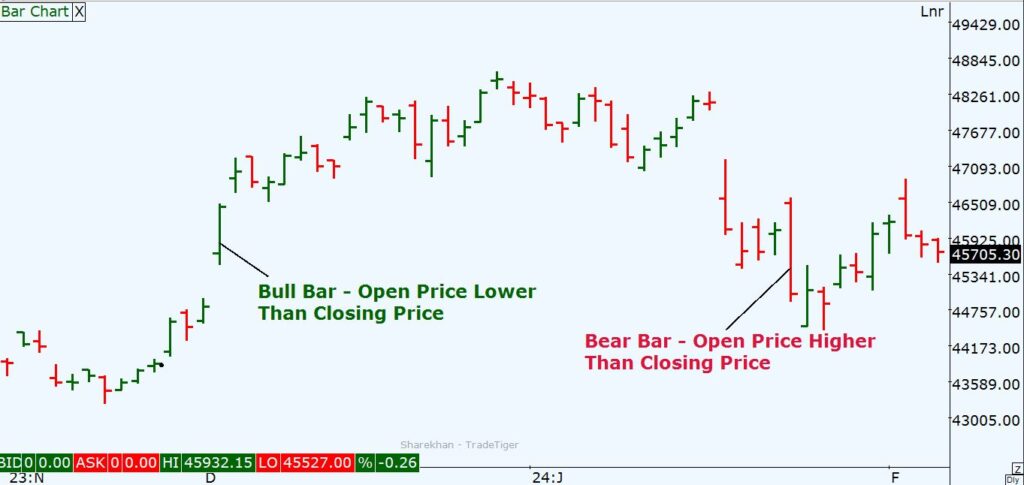
As per name this chart is formed using bars. Hight of bars denotes the price range in that particular time interval. A Bar chart shows more detailed information about price unlike line chart. A Bar chart shows four price levels Open, High, Low, Close and that’s why it is also called as OHLC chart. In Bar chart bars will be red or green. If open price is lower than closing price then green bars (bull bars) will be formed and if the open price is higher than closing price then red bars (bear bars) will be formed.
Candlestick Chart:
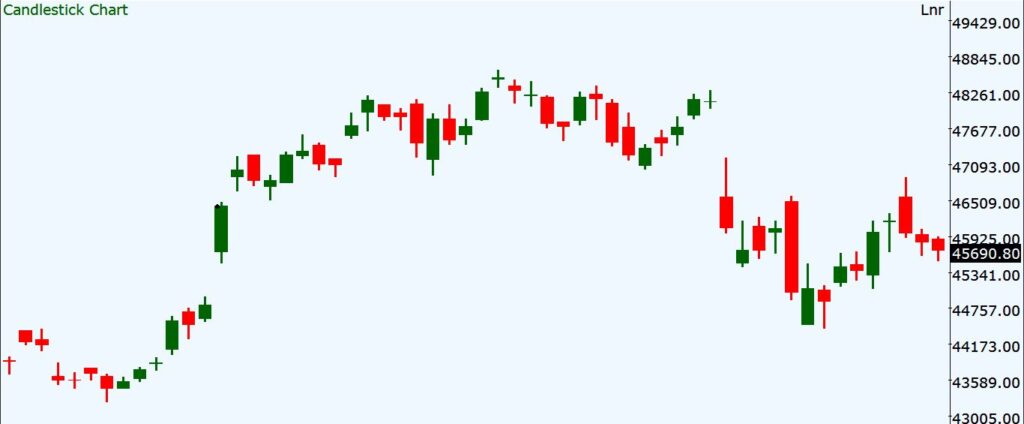
Candlestick chart was first introduced in Japan in 18th century by a Japanese rice trader Munehisa Homma. In 1980 Steve Nison discovered it and he made this methodology available to rest of the world. Because candlestick chart was first introduced in Japan that is why it is also known as Japanese Candlestick chart. This is most popular chart now a days that technical analysts using for their trading decisions. This chart forms using series of candles that represent four price point just like Bar chart, Open, High, Low, Close.
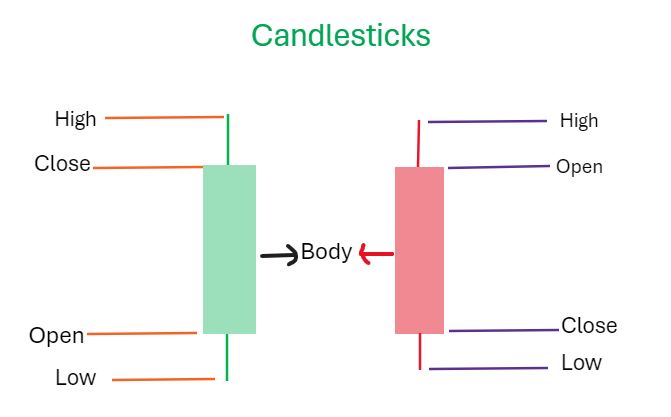
This chart also know as OHLC (Open-High-Low-Close) chart. In a particular time frame, when closing price is higher than opening price then a green bullish candle formed and when opening price is higher than closing price then red bearish candle created. Each candle has a upper wick, lower wick and a body part. The distance between open and close price represented by the body, upper wick shows the higher price and lower wick shows then lower price in that time interval.
Earlier technical analysts were using Bar charts for their analysis but now candlestick charts are more popular in technical analysts community. Later we will write some articles related to candlestick chart pattern that are very much popular in technical analysis because using chart patterns like Head Shoulder, Double top and bottom, Ascending triangle, Descending triangle, Symmetrical triangles, Wedges, Mega phones, rising wedges and filling wedges and many more.
Some other types of charts pattern are: Hekinashi chart, Renko Chart, Enhanced Candlestick chart, Point and Figure charts, Area charts, Kagi charts, etc but these charts are more complex and rarely used…. Please share your comment and feedback about this article and let us know if you like it. Also please keep sharing your ideas also… Thanks for visiting out blog and gave your valuable time here…
Great atul bhaiya