Table of Contents
In this brief article we will try to do technical analysis of Bajaj Finance and Kotak Mahindra Bank Using Price Action Pattern.
Price Action Analysis Of Bajaj Finance –Weekly Time Frame – Head & Shoulders Top

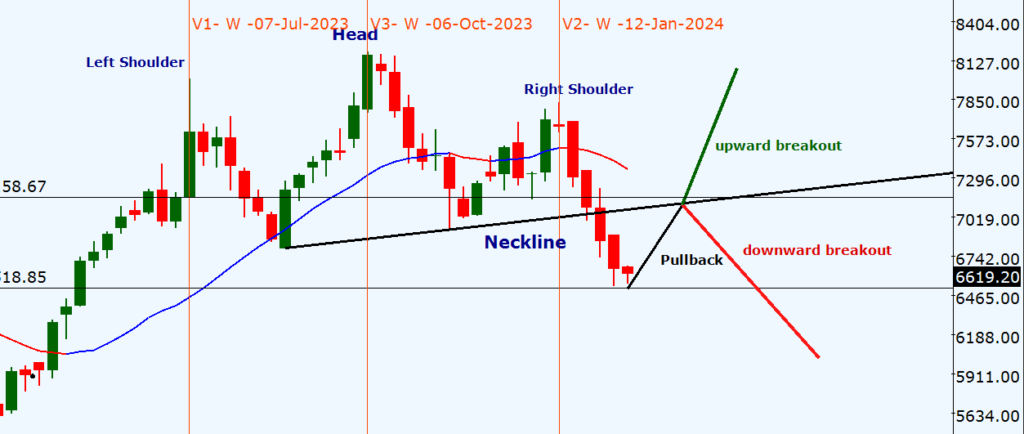
Above chart of Bajaj Finance showing weekly behavior of Institutions. On a weekly chart it is clearly a Head & Shoulder formation with neckline breakout after closing below the neckline. Between July,2023 and January, 2024 stock formed the pattern on weekly closing chart. Here on 7th July 2023 left shoulder was formed, On 06th Oct, 2023 a new high on weekly chart was formed which acted as Head formation, and finally on 12th Jan, 2024 right shoulder was formed.
Head and shoulder was completed after breaking the neckline. Now stock is near support and may take some pullback to retest broken support of neckline trendline (Black line is retesting level). At retesting level stock may give either positive breakout or may continue to go below and make a new low. Lest add this stock in our watchlist to check future price pattern.
Head & Shoulder is a three peak formation where the center peak is taller than the others. This is a short term bearish reversal pattern. Its performance is amazing compare to other price action pattern formations. We will learn this pattern later sometimes. Also Read How to Use Technical Analysis and Fundamental Analysis for Your Trading Advantage
Price Action Analysis Kotak Mahindra Bank – Weekly Time Frame – Range Bound In Box

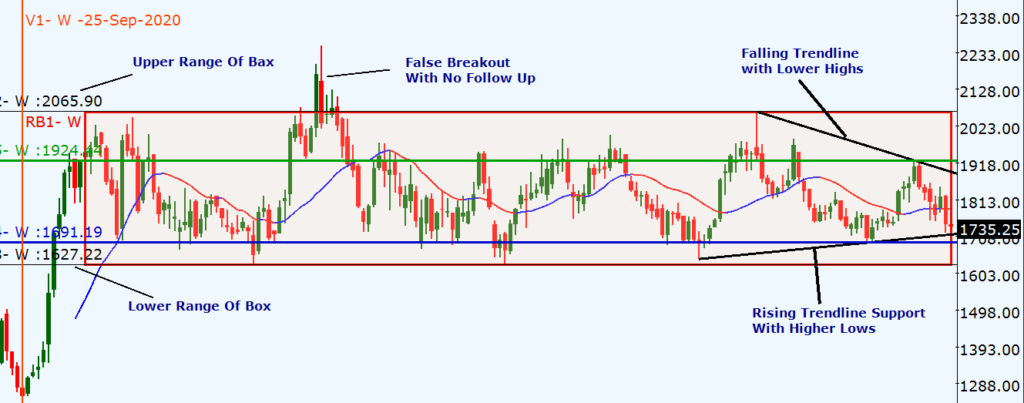
Kotak Mahindra bank’s Weekly chart showing price pattern since 2020 till now. In the above chart, we can easily find the trading range of stock. On September, 25th 2020 kotak mahindra bank make its low of 1230 and after that stock gave a strong breakout rally to reach new high level near 2065.
After making high stock stock gave 50% retracement and created lower boundary of box trading range between 2065 & 1625. In October 2021 stock gave a positive breakout but no follow up on weekly chart and again fell down till 1627 to hit lower boundary of box trading range. Since March, 2023 stock also making symmetrical triangle pattern inside the box.
Symmetrical triangle is a pattern of higher low and lower high formation. In this above image you can see rising trendline with higher lows and falling trendline with lower highs, both together forming symmetrical triangle. Now symmetrical triangle is a pattern with 50-50 chances of either side breakout. So one may wait till stock does not give breakout and once breakout happen then we may go with breakout direction. After triangle breakout stock must test the box boundary as a resistance. And Finally after box breakout with follow up a strong move in breakout direction must come. Lets add this stock to watchlist and observe future price action.
Disclaimer: This analysis is purely for educational purpose and does not contain any recommendation. Please consult your financial advisor before taking any financial decision.