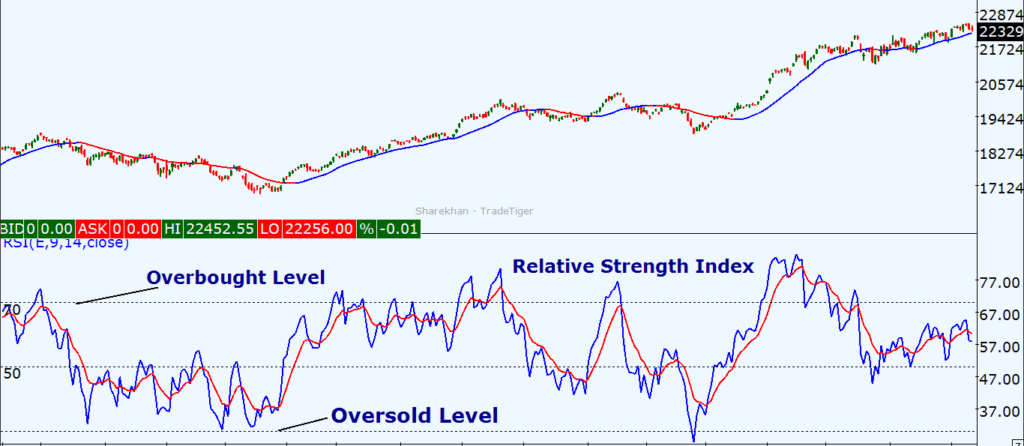
The Relative Strength Index (RSI) is a popular technical analysis indicator that helps traders identify overbought and oversold conditions, as well as potential trend reversals. RSI Divergence occurs when the price movement and the RSI’s behavior diverge, signaling a potential shift in market direction.
RSI divergence can be classified into two types: bullish and bearish. Let’s explore each type in detail and understand how to recognize them in your trading charts.
Types of RSI Divergence
Bullish RSI Divergence
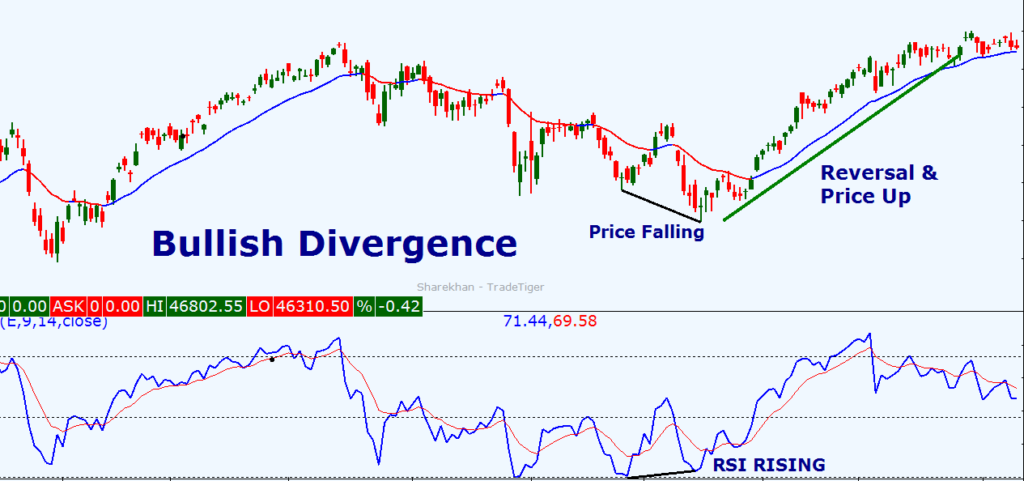
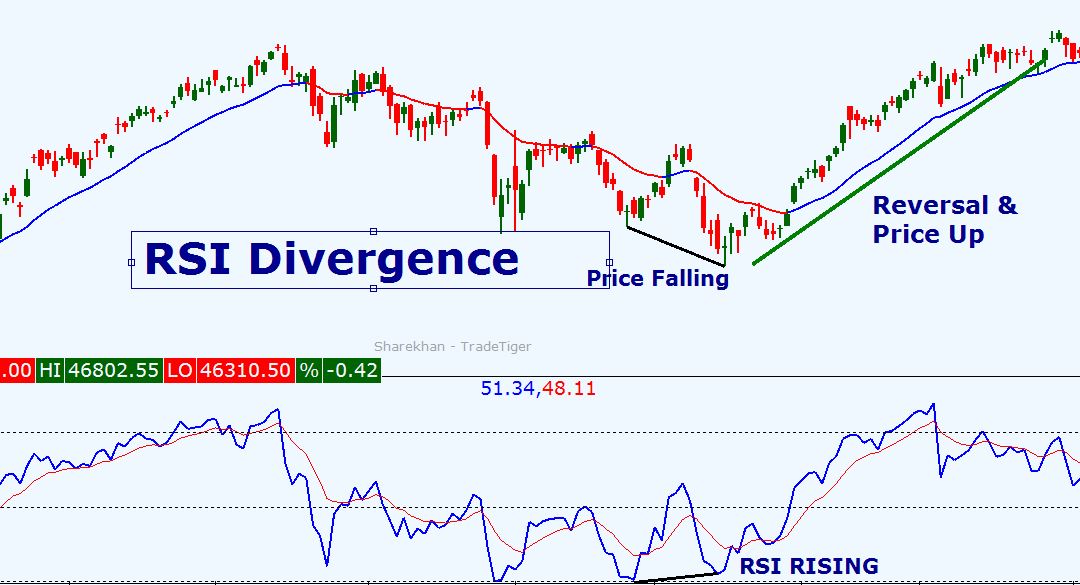
Bullish RSI divergence occurs when the price of an asset forms a lower low, but the RSI indicator forms a higher low. This indicates that the selling pressure is weakening, and a potential upward reversal is likely to occur. Traders often interpret this as a signal to enter a long position or to hold onto existing long positions.

To identify bullish RSI divergence, look for lower lows in the price chart and higher lows in the RSI indicator. This discrepancy suggests that while the price is declining, the momentum is shifting, indicating a possible trend reversal. It is important to wait for confirmation from other technical indicators or price action before making a trading decision.
Bearish RSI Divergence
Bearish RSI divergence occurs when the price of an asset forms a higher high, but the RSI indicator forms a lower high. This suggests that the buying pressure is weakening, and a potential downward reversal is likely to occur. Traders often interpret this as a signal to enter a short position or to exit existing long positions.

To identify bearish RSI Divergence, look for higher highs in the price chart and lower highs in the RSI indicator. This discrepancy indicates that while the price is rising, the momentum is decreasing, signaling a possible trend reversal. It is important to wait for confirmation from other technical indicators or price action before making a trading decision.
Also Read: The Ultimate Guide to Understanding and Using Stochastics Indicator
Using RSI Divergence in Trading Strategies
Now that we understand the different types of RSI Divergence, let’s explore how to effectively incorporate this powerful tool into your trading strategy.
- Confirmation from other indicators: Relying solely on RSI Divergence may not always be sufficient. It is crucial to seek confirmation from other technical indicators, such as moving averages or trendlines, to validate the potential reversal signal.
- Combining with price action: RSI Divergence works best when combined with price action analysis. By analyzing candlestick patterns, support and resistance levels, and trendlines, you can enhance the accuracy of your trading decisions.
- Multiple time frame analysis: RSI divergence can be more reliable when observed across different time frames. For example, if you spot bullish RSI divergence on the daily chart, it may carry more weight if it is also present on the weekly or monthly chart.
- Risk management: As with any trading strategy, risk management is crucial when using RSI divergence. Set appropriate stop-loss orders to protect your capital and consider incorporating proper position sizing techniques.
Tips for Using RSI Divergence Effectively
To maximize the effectiveness of RSI divergence in your trading, consider the following tips:
- Practice on historical data: Before applying RSI divergence to live trading, practice identifying and analyzing divergences on historical price charts. This will help you develop the necessary skills and confidence.
- Learn from experienced traders: Engage with experienced traders or join trading communities to learn from their insights and experiences with RSI divergence. This can provide valuable guidance and help refine your trading strategy.
- Keep track of successful trades: Maintain a trading journal to record your trades involving RSI divergence. Analyze your winning and losing trades to identify patterns and improve your decision-making process.
- Adapt to market conditions: Market conditions can change, and RSI divergence may not always be as effective. Stay flexible and adapt your trading strategy accordingly. Consider using RSI divergence in conjunction with other technical analysis tools to increase your chances of success.
Common Mistakes to Avoid when Using RSI Divergence
While RSI divergence can be a powerful tool for traders, it is essential to avoid common mistakes that can undermine its effectiveness. Here are some mistakes to avoid:
- Overreliance on RSI divergence: RSI divergence should not be the sole factor in making trading decisions. It is important to consider other technical indicators, market fundamentals, and price action to validate potential reversals.
- Ignoring the overall trend: RSI divergence should be used in the context of the overall trend. If the divergence contradicts the prevailing trend, it may not be a reliable signal.
- Premature entries or exits: Jumping into a trade solely based on RSI divergence without waiting for confirmation can lead to false signals and losses. Exercise patience and wait for additional confirmation before entering or exiting a trade.
- Failing to adjust parameters: The default settings of the RSI indicator may not always be suitable for every trading scenario. Experiment with different parameters and time frames to find the settings that work best for the asset you are trading.
Examples of RSI Divergence in Real Trading Scenarios
Let’s explore a few examples of RSI divergence in real trading scenarios to illustrate how this powerful tool can be applied effectively.
- Bullish RSI Divergence: Suppose you notice a stock’s price forming lower lows, indicating a downtrend. However, during this downward movement, the RSI indicator forms higher lows, suggesting a potential reversal. This bullish RSI divergence could be a signal to enter a long position or to hold onto existing long positions.

Bearish RSI Divergence: In another scenario, you observe a cryptocurrency’s price forming higher highs, indicating an uptrend. However, the RSI indicator forms lower highs, indicating weakening momentum. This bearish RSI divergence could be a signal to enter a short position or to exit existing long positions.

These examples highlight how RSI divergence can provide valuable insights into potential trend reversals and help traders make informed trading decisions.
Conclusion
The RSI indicator and RSI divergence are powerful tools that can significantly enhance your trading strategy. By understanding the intricacies of RSI divergence, identifying bullish and bearish divergences, and incorporating this tool into your trading strategy, you can improve your timing, identify potential entry and exit points, and gain an edge in the markets.
Remember to use RSI divergence in conjunction with other technical analysis tools, practice on historical data, and adapt to changing market conditions. By avoiding common mistakes and continuously learning from experienced traders, you can fully harness the power of RSI divergence and take your trading game to the next level.
